cool & simple excel tricks for data-cleansing
Who doesn't know Microsoft Excel?
Everybody knows it since childbirth (lol, jk). This tool is very easy to use, plus it is the one that most of us already got pretty familiar with. Maybe some of you may think that excel is too old-fashioned or not-fancy-enough for data cleansing. Well, including me. But it has some powerful features that can be a good companion for our data-science journey.
In this post I would like to share some of the cool features that I often use to clean the raw data, before I can have a lot more fun with it in finding insights and building models.
But first, there are some prerequisites before we decided using this tool instead of Python or other language. You may consider using Excel if :
- Your dataset is less than 1.000.000 rows, and as long as your PC/laptop (or your soul-patience) still can handle it :)
- The pattern of the data is still recognizable to be handled by excel functions
- The data does not have to be cleansed in a regular basis and does not need documentation for the cleansing process
- Need to finish faster
- Need to clean data manually, as the data is too complicated or too diverse to use any functions
There are some trade-off in choosing the cleansing tool of course, sometimes 'manual-work' even able to save considerable amount of time when the data is too disorganized to find its pattern. Sometimes finding the pattern itself can took lots of time. Unless we already got too familiar with it.
Other case, using sophisticated libraries may not always be the silver bullet, which may still needs additional steps to get the result that we want, since it very depends on the data. The 'real' data almost never as pulchritudinously organized as Kaggle's.
So here we goo.... 10 cool and simple excel tricks for data cleansing!
1. Filter, sort and drag-down combination
Real data can be very daunting. Typos everywhere, different text-cases here and there. This is one of the most basic tips, but it can save lots of time when dealing with mistyped words. Since this is a bit of manual work, I suggest to use this when you do not have too many variation in your data, otherwise it shall be better using python library like fuzzywuzzy.
Simply filter, sort them up and drag down the correct cell to replace the mistyped. No need to think at all.
2. Paste-value as text
Oh God...this one is so important especially when we're dealing with numerical datas. Excel is awfully troublesomely preprogrammed that it automatically transforms certain number to date/time format. For example: 11-2 changes to 11-Feb. It can be very frustrating when you enter something that you don't want changed to a date. Bad news is there is no way to turn this off. So whenever, it is better to copy and paste value then change text before we do the next steps. Only to turn to number when we're using them in calculation.
3. Find and replace
This utterly simple feature, can save lots of time to replace unwanted characters in our data. It can also used as removal by simply replacing with none.
4. &
Use this to merge two columns without hassle, add up with " " or desired character. This trick is also beneficial to create key when you want to match it using vlookup.
5. Trim and clean
The combination of trim and clean will get rid of excessive space, line breaks and unprintable character. A truly savior.
6. Proper, upper, lower and sentence case
We all want the ugly-cased texts to be as humanly as possible. Take a look for below :
=PROPER()
=UPPER()
=LOWER()
We have all proper, upper and lower, but what about sentence case???
Sadly excel still does not have this function yet, but we can tweak in a bit to get it. Feel free to copy and paste this formula. You're welcome.
7. Text-to-columns
This one is the coolest thing ever! No matter how ugly-looking the data was, we can do couple of things to make it look better by using this feature. Basically splitting data in a cell to multiple columns, with certain desired separator.
- Choose one column (it won't work with multiple columns), then go to Data -> Text to Columns
- In this example, I will use column A
- You can choose between 'Delimited' or 'Fixed width'. Delimited for splitting with certain characters (e.g : colon, semicolon, blanks, etc). If you have data with uniform length, you can split them up using Fixed width and set them manually.

- Choose the separator character. You can specify other char at the 'Other'
- Additional tips, don't forget to set the numerical column as text if you don't want it changed to the doomed date/time format. Then hit Finish
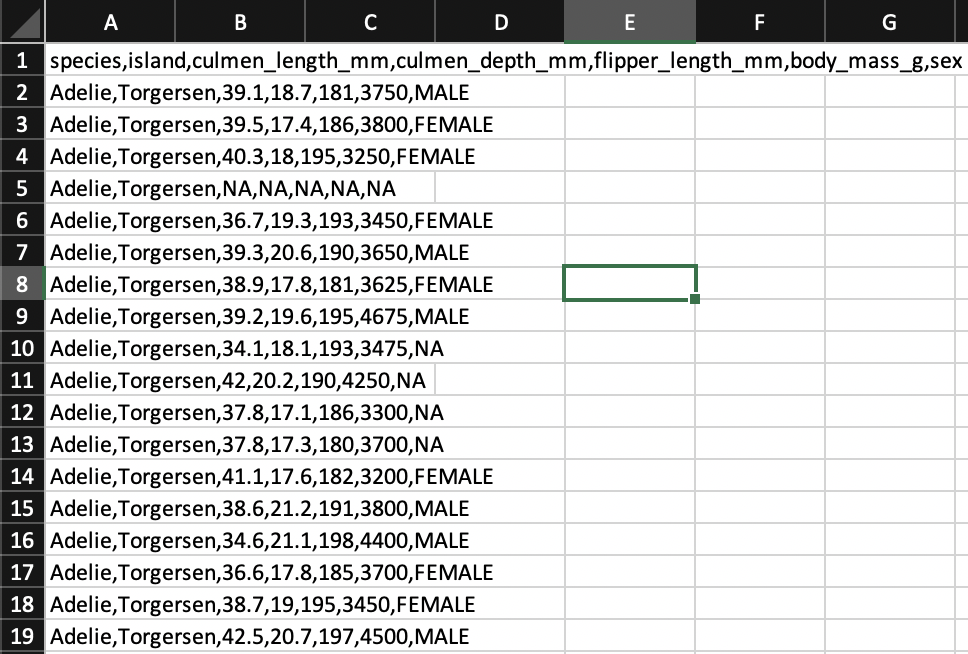
- Below is the result
8. Highlight cells
We can highlight cells with certain criteria. This is very useful to look at blank values or errors. We can easily do filtering later on.
- Select all data
- Select Home -> Conditional Formatting -> Highlight Cell Rules -> More Rules...
- Choose the desired criteria, then click OK
9. Handling blank cells / missing value
Blank cells or NaN can cause trouble. We can treat them beforehand using this feature to save lots of hours mending them manually.
- Select all data (or several columns only, depends on the use)
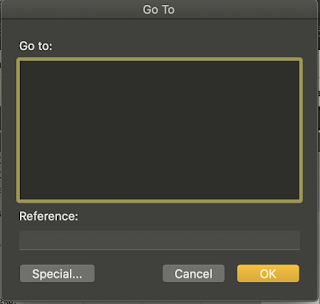
- Hit F5 to open the Go To dialogue box
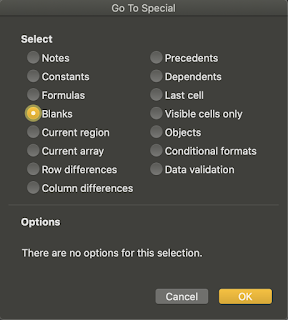
- Click on special

- Choose 'Blank' -> Ok

- This will select all the blank cells, type the desired value, then hit Ctrl+enter to fill in all of them. If you hit enter, it will only fill the active cell. You may want to fill in median/mean/zero/whatever is required.
10. Handling duplicates
In handling duplicates, we can either highlight them (refer to point 8) or remove them. To remove, simply do following steps :
- Select all data
- Go to data tab
- Select 'Remove duplicates'
- Choose the columns you want to remove
- Don't forget to tick 'My data has headers' so it won't include the headers
I tell you what, data-cleansing step is probably one of the most excruciating part of the whole project. So bear in mind that it won't always be done in a blink of an eye. Otherwise, if this part was done right, religiously and meticulously, it can save us from a cornucopia of troubles later on. So patience, with 'real' data, fellas.
Thanks for reading and have fun! <3
- credits : penguin database
- Gorman KB, Williams TD, Fraser WR (2014) Ecological Sexual Dimorphism and Environmental Variability within a Community of Antarctic Penguins (Genus Pygoscelis). PLoS ONE 9(3): e90081. doi:10.1371/journal.pone.0090081
- CC-0 license in accordance with the Palmer Station LTER Data Policy and the LTER Data Access Policy for Type I data.


Very useful tricks, I wish I knew it earlier. Thank you!
ReplyDeleteI read your blog now share great information here.
ReplyDeletedata cleansing tools